Visual to Parametric Interaction (V2PI)
 Visual Analytics
| September 15, 2009 – April 3, 2017
- Visual Analytics
Visual to Parametric Interaction (V2PI) is a non-probabilistic version of BaVA.
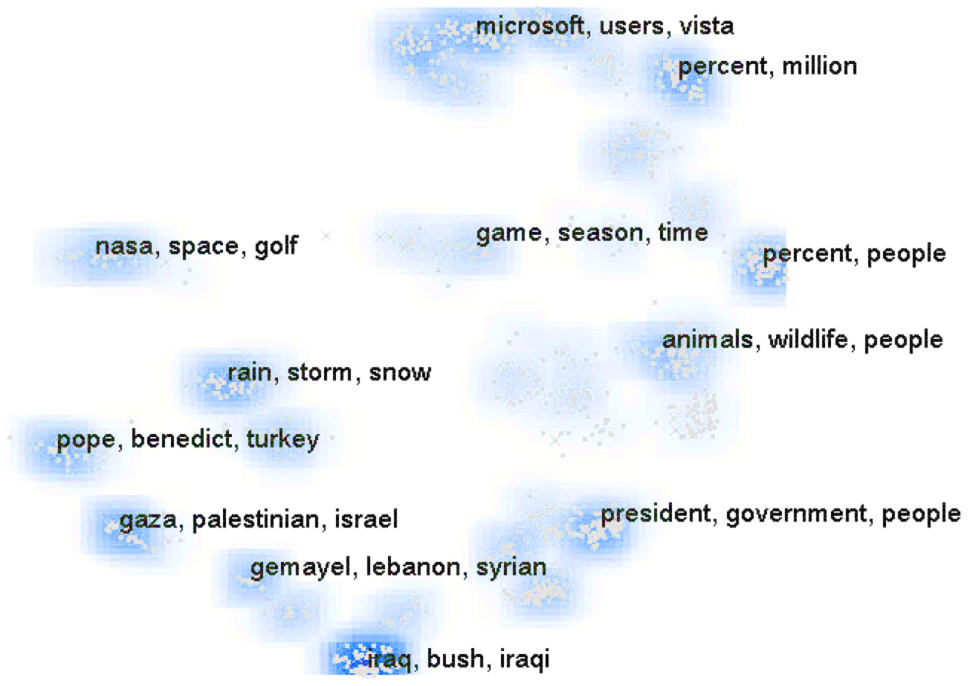
The easiest way for a person to comprehend a large amount of data is to do so visually. We are at our best when we can use our eyes to aid our understanding. While we can analyze data with a small number of dimensions using graphical tools, plots and charts and the like, these techniques break down for high dimensional data.
How to bring visual intuition to bear on high dimensional data is one of two fundamental problems the V2PI group seeks to solve. Our research centers around techniques for summarizing and projecting high dimensional data into a low dimensional representation that retains as much of the interesting structure as possible. This is done using the Andromeda system, which enables users to manipulate data points in a two dimensional weighted multidimensional scaling projection.
The second main thrust of research involves interacting with data once it has been visualized. Data can be viewed in many ways, and by allowing people to interact with data we can determine which features are interesting to them and which are not. This interaction between human and computer allows us to make discoveries neither agent could make in isolation. One example is our Be The Data project, in which students take on the roll of data in a 2D projection. Students can move around a space to interact and explore hypotheses about the data they embody.
People


Grants Provided By

National Science Foundation